News
Gold after the record: what a correction changes for a producer
After a peak of $5,589 an ounce in January, the price has fallen back to around $4,000. Reading a market that remains high, from the seat of the one selling the output.
Published on
On 28 January 2026, gold touched $5,589 an ounce, its all-time high. In early August it trades above $4,000 — close to 28% below that peak, after the worst quarter since 2013.
A retreat, not a collapse
Both halves have to be held at once. The pullback is sharp and fast. But $4,000 an ounce remains a level the market had never seen before this decade, and institutional demand is not weakening: central banks bought 244 net tonnes in the first quarter, and 89% of the seventy-six banks surveyed by the World Gold Council expect global reserves to rise this year.
In other words, it is financial flows — outflows from exchange-traded funds — that explain the correction, not a turn in physical demand.
What it shifts for a producer
Three things, in the order they arise.
- The selling calendar. Steady output mechanically smooths the average price; that is an advantage when the market is volatile, and a constraint when it rises.
- Funding the next campaign. A high price funds the next round of extraction; a 28% correction tightens that margin without erasing it at current levels.
- The choice between selling now and holding. It depends less on forecasts than on available cash.
What the forecasters say
They diverge, which is itself information. J.P. Morgan sees the ounce at $6,000 by year-end. Standard Chartered holds an average of $4,650 for the fourth quarter.
A gap of that size between two serious houses is an invitation to base no operating decision on a price forecast. The prices shown on this site are indicative, updated daily, and serve as a reference — not as a contractual basis.
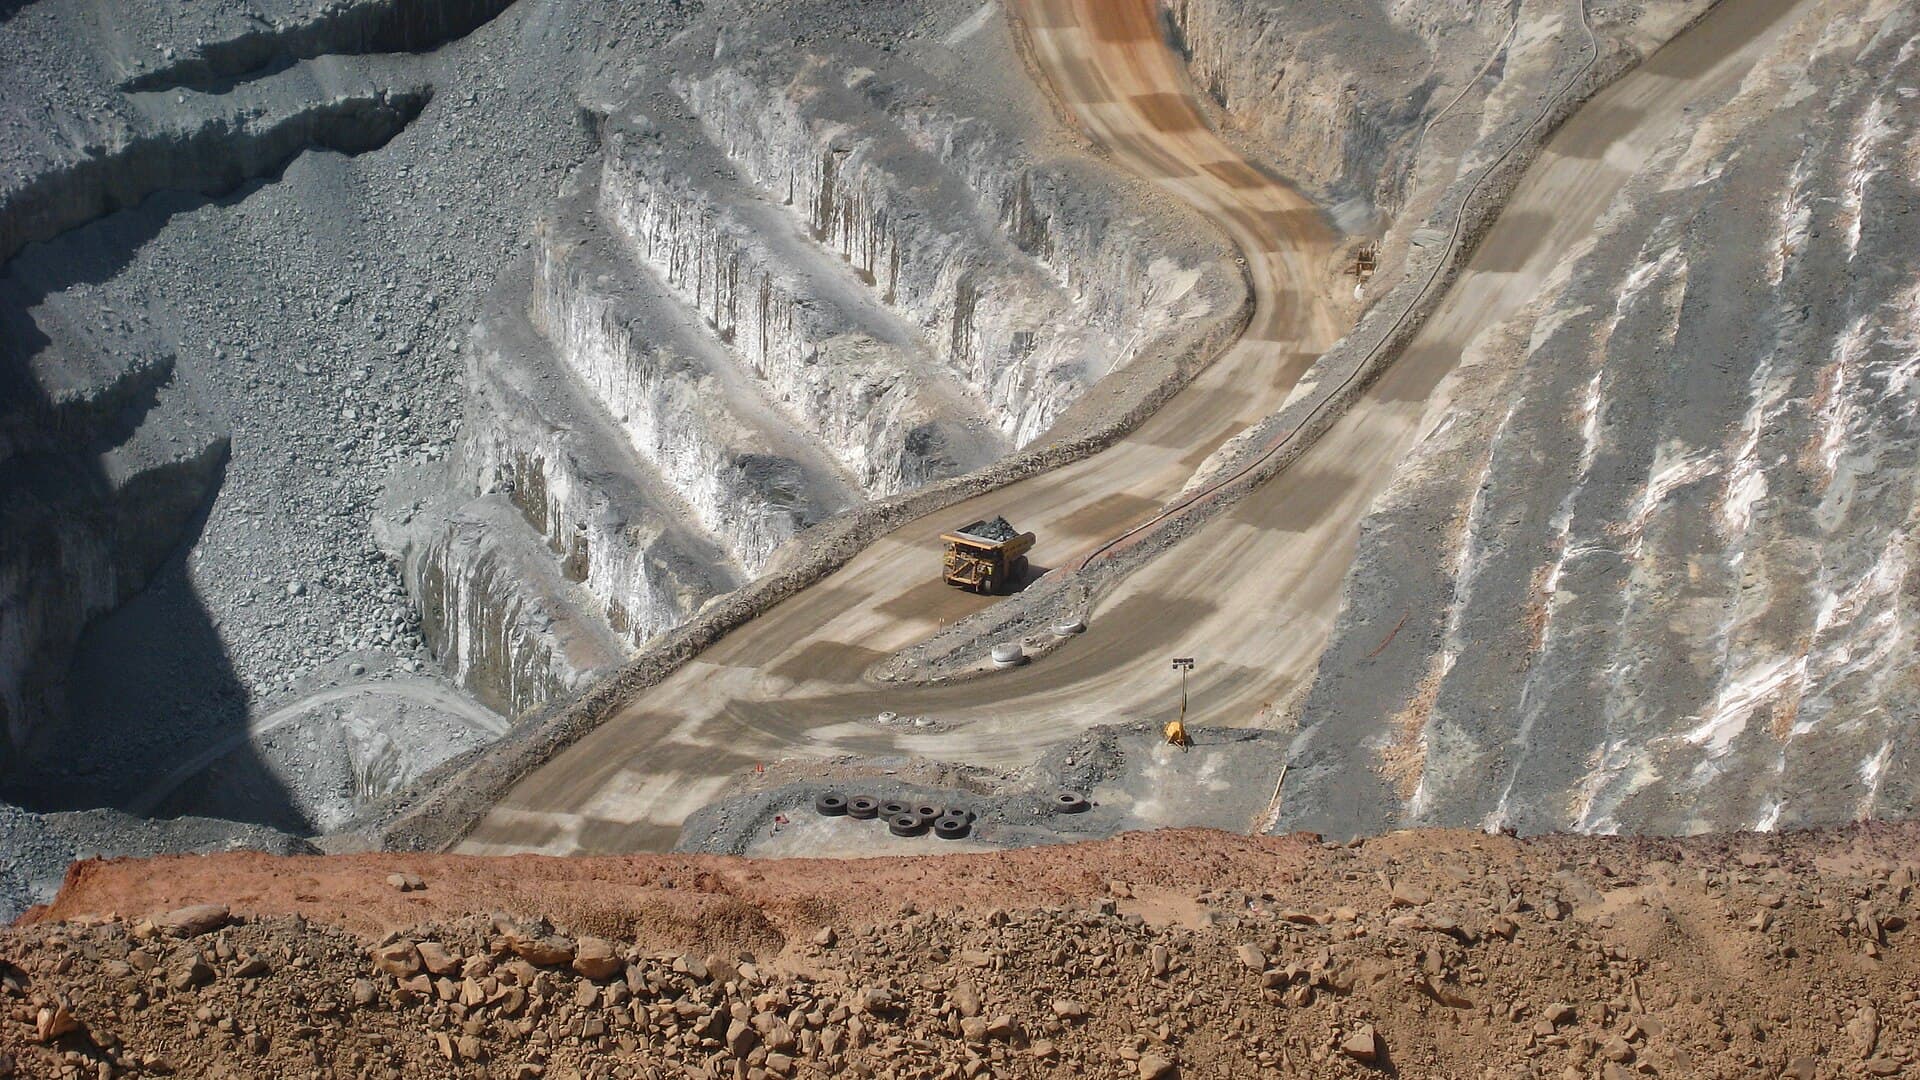
Sources: World Gold Council, J.P. Morgan Global Research. Photograph: Calistemon, CC BY-SA 4.0.